 |
|
At the 2010 Missouri Botanical Garden workshop to promote the idea of digitizing and aggregating US herbarium specimen records, a CCH cumulative record map created by Dick Moe was displayed by several speakers. Ron Hartman asked him at one point to display the records in such a way that the map would better convey collecting effort. The maps below are updated versions of Dick Moe's revised designs based on Hartman's request.
These are maps of CCH records that have coordinates (think of it as an autogeograph). In the map at the right the pixels are colored according to the number of collections at an approximate location, giving a visual representation of collecting effort.
NOTE: The addition of new CCH2 herbaria and updates of existing ones are not complete. There are a dozen or so small herbaria that have yet to be processed and added to CCH1. Some of these small herbaria do not meet the standards of CCH1 and will never be added. CCH1 is very selective on the data included and should not be interpreted as a clone of CCH2.
Summary
Between 2018 and 2025, the percent white space has decreased by 7%. This means that georeferences and new collections have covered 7% of the space that was white in 2018. However, blue pixels or ones that are covered by 1 or 2 georeferences have increased by less than 1%. It is all other classes that have increased by 1 to 3% over this time period. This implies that specimen collecting trips and georeferencing projects have covered white space with 3 or more georeferences in the same pixel between 2018 and 2025. The georeferencing and collecting effort has increased most in black pixel regions. Black pixels with 32 or more georeferences have increased from 9% to 12%. One interpretation of these results is that collecting and georeferencing specimens from popular or well-known localities is a common community activity. The inclusion of specimens from worldwide herbaria has not contributed much to the adding of colored pixels to unoccupied white space. In other words, most of the specimens from worldwide herbaria are either duplicates of specimens already in California herbaria or visiting botanists also predominantly collect from well-known localities.
The map below represents 78% of the specimens in the ~270 herbaria in CCH1:
2,589,906 georeferenced out of 3,270,303 total specimens.
Thu May 27 11:20:45 2025
|
all georeferences |
68344 white pixels (%space estimate without georef's): 50% 17202 blue pixels (1 or 2 georeferences): 12% 7905 green pixels (3 or 4 georeferences): 6% 18656 yellow pixels (5-16 georeferences): 14% 8866 red pixels (17-32 georeferences): 7% 16496 black pixels (> 32 georeferences): 11% 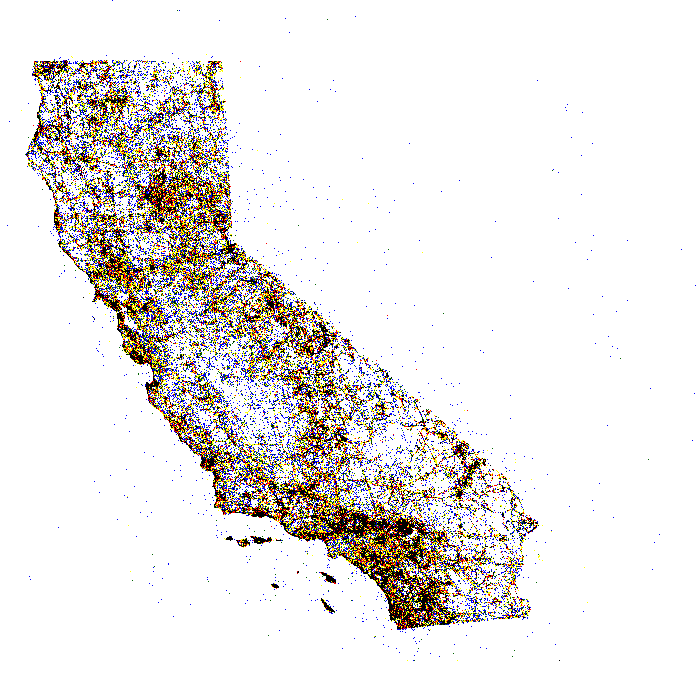
|
There are currently around 500,000 more specimens in CCH2 that in the CCH pre-2018 portal. Of these, many are from non-CCH herbaria that are included as snapshots and not part of any CAP-TCN grant (US,NY,A,ECON,AMES,GH,MIN,RENO). The SEINET collection present in 2018 and not currently present was composed of over 14 herbaria that added a total of over 200,000 specimens. As a result, it is difficult to determine exactly how many specimens from member herbaria were added between the 2018 counts below and the current database based solely on these type of comparisons.
In 2018, there were 1.8 million georeferences in the pre-2018 CCH portal. In 2024, there were 1.6 million from Calfornia herbaria in CCH2. A very large segment of this difference is due to one snapshot collection: CAS. Even though the buffer files were added to CAS in 2019 by the CAP-TCN grant. Those georeferences have been overwritten in recent updates since CAS has never added the over 80,000 georeferences from the pre-2018 CCH georeference buffer. A small subset of other collections did not want buffer coordinates added to CCH2 and preferred to create new ones during the grant. There are other yellow flag projecct related corrected and new georeferences present in the old portal that were declined to be added when files were given to each collection manager as CCH1 error files between 2018 and 2020. These three datasets are the main reasons for the difference between the pre-2018 portal and CCH2.
If you add CAS georeferences in CCH1 that were never added to the CAS home database, the total georeferenced specimens goes up to 66%. Between 2014 and 2018, the online CCH portal added 7 to 10 percent more georeferences to the database than were present in raw data sent to CCH for processing. Prior to 2013, the georefereced percent was less that 50%. Between 2013 and 2018, the georeference percent ranged between 60 and 66%. So the current members of CCH2 are keeping relatively the same pace of adding non-georeferenced specimen records versus georeferencing existing records that was present in the pre-2018 CCH portal.
The 2024 map represents 61% of the specimens in the ~63 California herbaria in CCH2:
1,628,894 georeferenced out of 2,674,628 total specimens.
Fri Dec 3 13:06:02 2024
|
all georeferences 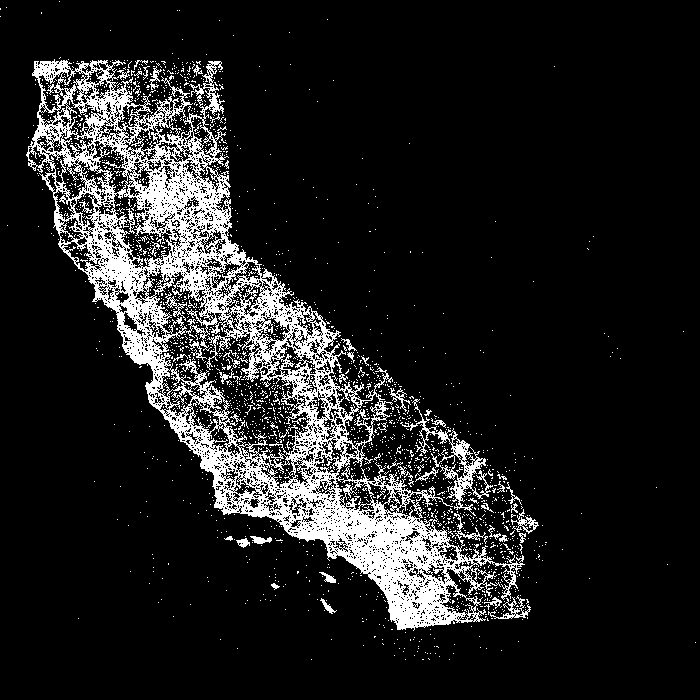
|
74864 white pixels (%space estimate without georef's): 55% 18258 blue pixels (1 or 2 georeferences): 13% 7888 green pixels (3 or 4 georeferences): 6% 17252 yellow pixels (5-16 georeferences): 12% 7498 red pixels (17-32 georeferences): 5% 11563 black pixels (> 32 georeferences): 9% 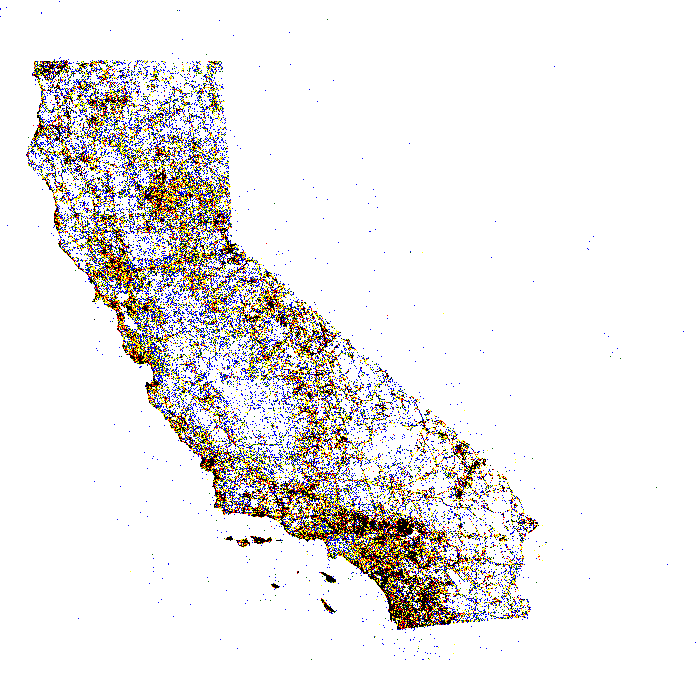
|
Summary
Compared to the CCH2 only counts above, the data from 2018 included herbaria not present in CCH2 in 2024. The data includes SEINet records which were agglomerated into one herbarium category (SEINET) but were actually nearly 14 additional herbaria
There are differences between the datasets in 2018 versus the current version of CCH2 in 2024. The georeferences in 2018 included ones from these 14 SEINet herbaria plus tens of thousands of additional georeferences for these herbaria from the buffer. In addition, the portal included over 80,000 changed and added georeferences from CCH1 files. These data are only partially present in CCH2 in 2024. For the CAP TCN grant, the only records from the CCH1 georeference buffer that could be added to CCH2 were ones for live collections that had no georeferences. So even in 2024, not everything that was in the pre-2018 CCH portal are in the CCH2 portal. At this stage this is a permanent difference and these will not be added to CCH2 for various reasons, including the changes being rejected by the herbaria's data manager or changes that cannot be overwritten in CCH2 due to unalterable parameters required for CCH2 skeletal file imports. There are no other data sets from pre-2018 CCH archives that will increase the percent georeferenced counts in CCH2 to match that present in 2018.
The map below is the 2018 version, which 78% of the specimens in the 55 herbaria in the pre-2018 CCH:
1882440 georeferenced out of 2313930 total specimens.
Mon Jan 24 17:26:45 2022
|
all georeferences 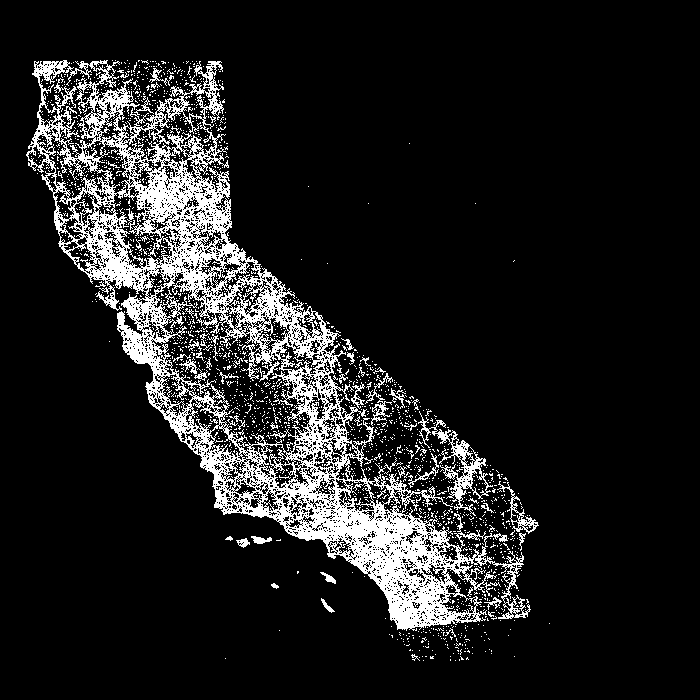
|
77516 white pixels (%space estimate without georef's): 57% 16381 blue pixels (1 or 2 georeferences): 12% 7285 green pixels (3 or 4 georeferences): 5% 16547 yellow pixels (5-16 georeferences): 12% 7495 red pixels (17-32 georeferences): 5% 12035 black pixels (> 32 georeferences): 9% 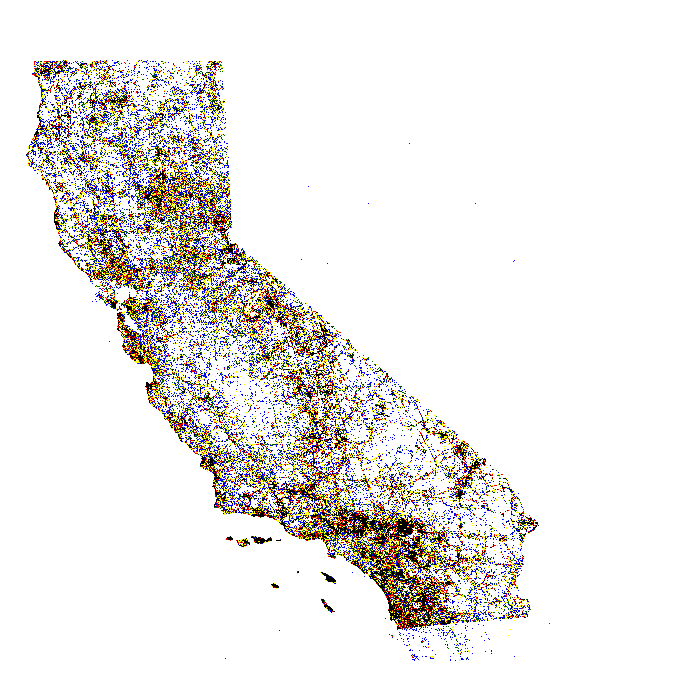
|
Please send questions or comments regarding the development and use of these pages to Jason Alexander (jason_alexander@berkeley.edu).