
A. Generalized plasticity response to environmental change. The environment is
sensed by an organism exhibiting phenotype 1. The genes of this organism respond by a
physiological change producing phenotype 2. This response to environmental influences can
occur in a single individual or from one generation to the next.
B. Schematic representation
of the plastic response in Scenedesmus. The environment affects phenotypes 1, 2, and 3
causing the production of the next phenotype in the cycle. Often a mixture of phenotypes
would be found in nature for there is genetic variation for plasticity within a single population
and because environmental circumstances are not uniform throughout the range of distribution
of the population (even within the same locality).

Figure 2. Growth responses from 5 clones of Stigeoclonium tenue from the Netherlands to varying concentrations of phosphorus, ammonia, and chloride. Clones 21 and 25 are sympatric as are 29 and 34. Differences in the response of these sympatric clones are taken as evidence for local polymorphism. Differences between allopatric clones reveal the existence of ecotypes as show in growth responses. Graphs have been prepared based on data presented by Francke & ten Cate (1980).
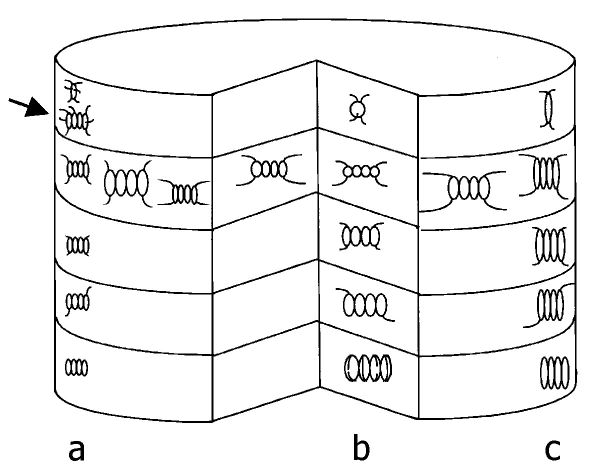
Figure 3. Diagrammatic presentation of the morphs of several taxa within the genus Desmodesmus, organisms formerly called Scenedesmus (see text). The layered cake would represent some, or all if one wished, of the members within the genus. For comparative purposes similar morphologies, such as quadricaudates, are positioned in one layer, with a gradation of layers from more spiny cells (top) to spineless (bottom). A slice of the cake would represent a plastic species, one growing in a fluctuating environment. That slice, whether a, b or c, has a number of morphologically different forms, each produced in response to a specific environmental signal. Arrow, in potential slice a, indicates production of an additional multispined, colonial morph when the signal was a spring low temperature.

Figure 4. Schematic representation of the hypothetical relationship among morphs of Fragilaria sensu lato published in the literature. Due to recent taxonomic changes, morphs illustrated here may be found in different varieties, species and even genera. The morphs in a (F. brevistriata) and b (F. construens) are arranged in no particular order. Each slice of the cake is designed to represent a species. The third layer represents different elliptical morphs produced by 5 different "species." The arrow points to the morphs that could be produced by F. contruens (cruciate, biundular, elliptical, triradiate, and linear). Only the average (the most common) genotype is depicted on this slice. In reality, the slice for F. contruens should be much thicker to include all genotypes within the species, which are also able to produce the different morphs (see text and Fig. 4). All pictures in a (except second layer) after Rumrich et al. (2000). Picture in fourth layer of b, courtesy of Dr. R. Bixby.

Figure 5. Different morphs of Fragilaria construens from Avery Pond, CT (USA) as shown by SEM. First column: typical morphs of F. contruens, F. construens aff. var. subsalina and F. construens var. venter. Second column: morphs with wider areolae arranged in shortened striae. Third column: morphs with wider areolae arranged in longer striae. Scale bars (from top to bottom): first column: 2, 5, and 2 µm; second column: 2, 2, and 2 µm; third column: 2, 2, and 2 µm.